See brother, this chart is very easy to understand. Look at it like this:
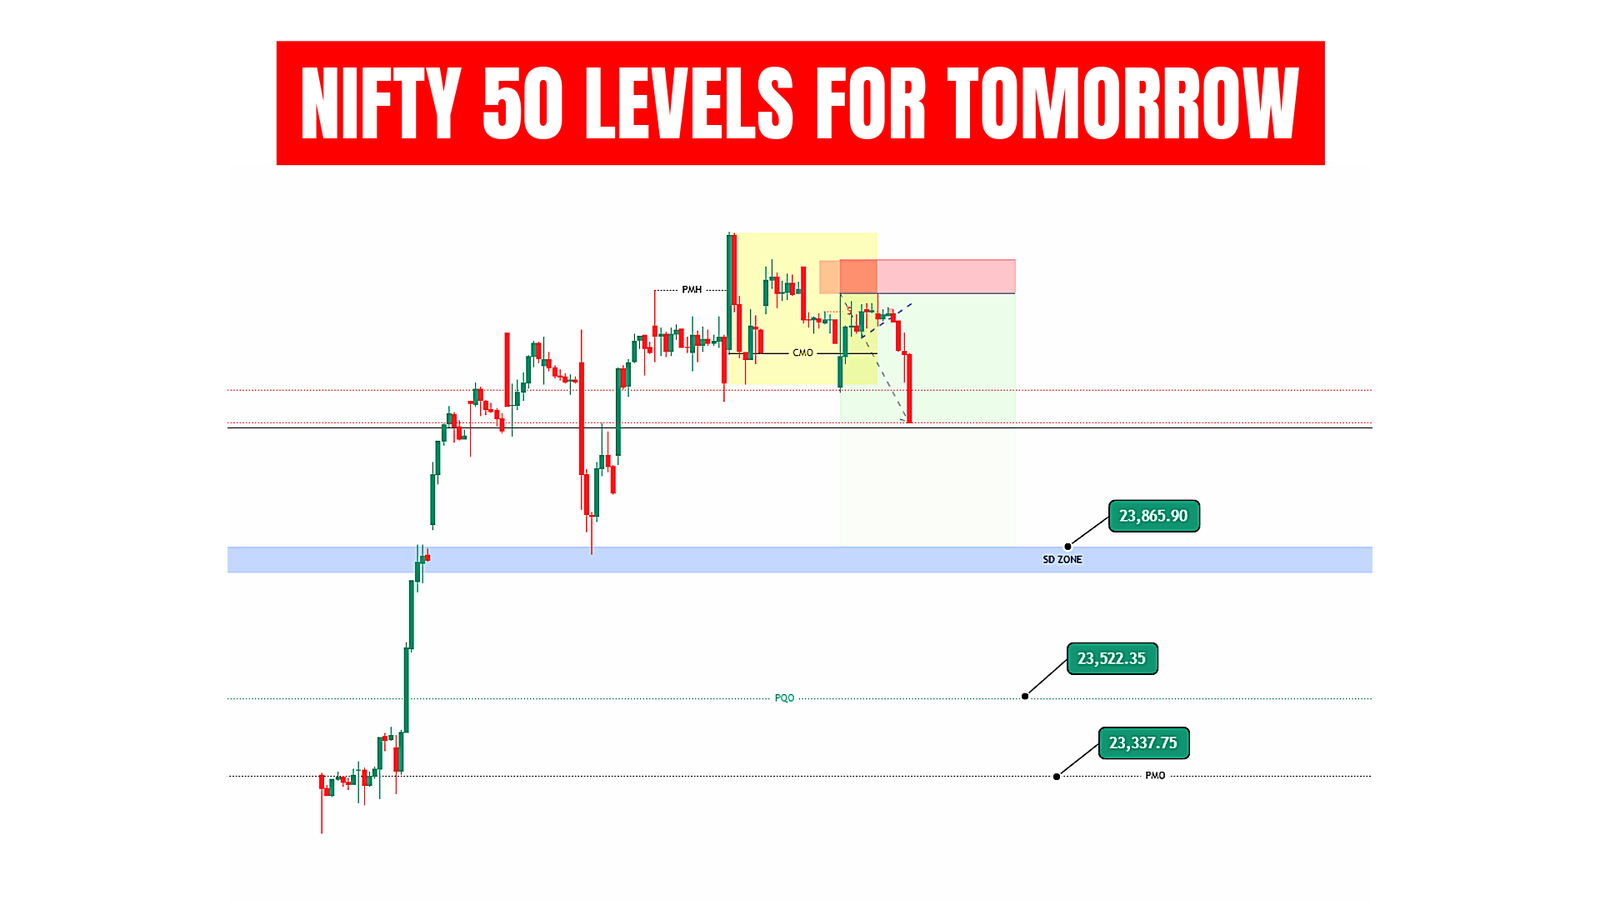
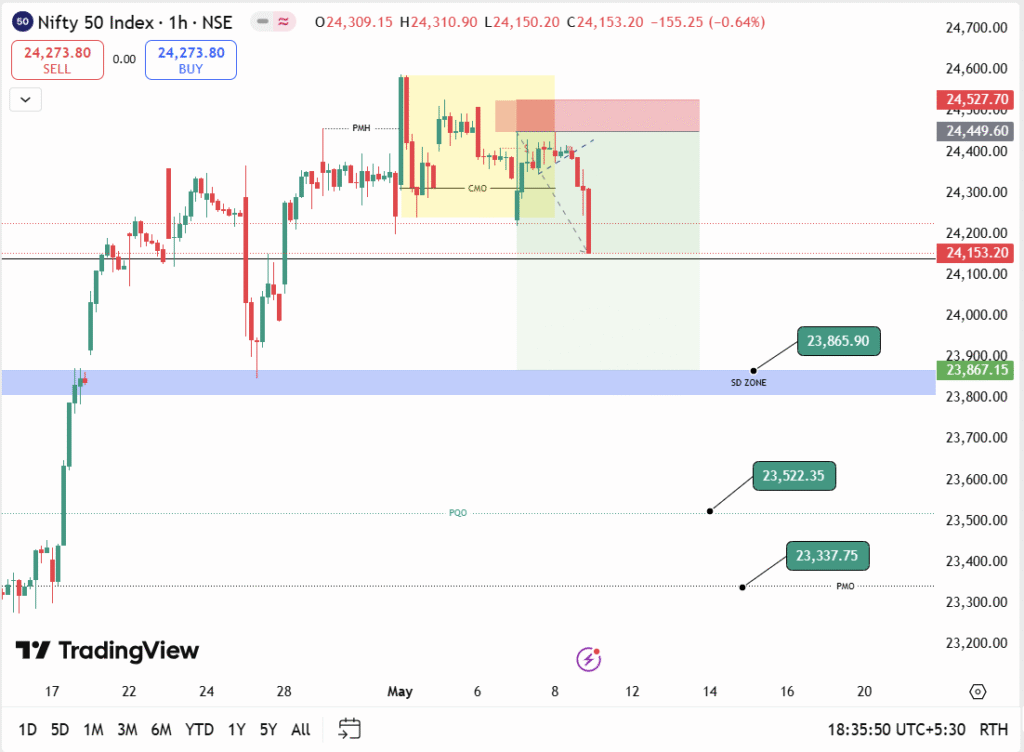
Nifty 50 Prediction Tomorrow –
1️⃣ Where to sell?
The red part (around 24,450 to 24,527):
When the price reaches this red area and stops there and starts falling down, then sell it.
This is the place where the price stops after going up and falls down.
2️⃣ Where to buy?
The blue part (around 23,865):
When the price reaches this blue area and starts rising from there, then buy it.
This is the place where the price stops after falling and then rises up.
3️⃣ What if the price falls further down?
23,522 and 23,337:
If the price breaks the blue area and goes down further, then these two places will be the next support. There may be a chance to buy here too.
In simple terms:
Red zone = “Place to sell”
Blue zone = “Place to buy”
Just see how the price reacts at these places.
Things to keep in mind:
- Do not trade without thinking.
- Make sure to place a small stoploss so that the loss is minimized.
Just keep a calm mind and go with the trend. Got it? 😊
“For more trades and updates, follow me on Telegram !”
Read More related – ABB India Limited Share Price Prediction